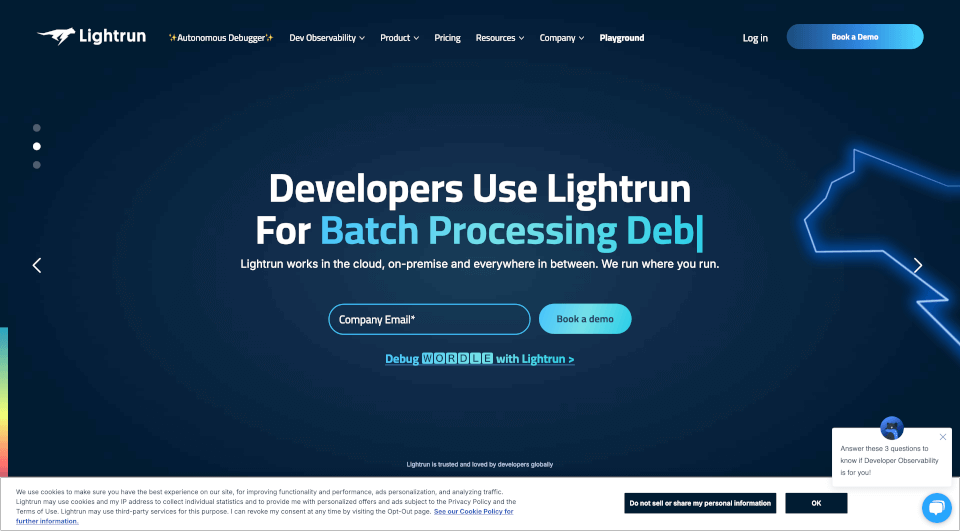
What is Lightrun?
Lightrun is an innovative Developer Observability Platform that allows developers to instrument logs, metrics, and traces dynamically in live production applications directly from their Integrated Development Environment (IDE). This powerful tool enables real-time insights into application behavior without the need for code changes or redeployments, significantly enhancing the debugging and troubleshooting process.
What are the features of Lightrun?
Lightrun provides a multitude of features designed to streamline development and operational processes:
-
Dynamic Instrumentation: Instantly add logs, metrics, and traces to your applications on the fly without any downtime. This dynamic approach helps developers capture the necessary data right where they need it, in real-time.
-
Zero-Config Metrics: By eliminating the need for extensive setup, Lightrun allows developers to monitor application performance metrics immediately, enabling rapid response to performance issues.
-
Snapshots (Virtual Breakpoints): Capture the state of your application at a specific moment without interrupting its operations. This feature is crucial for understanding application state and diagnosing issues effectively.
-
Support for Multiple IDEs and Languages: Lightrun integrates seamlessly with popular IDEs like IntelliJ IDEA, Visual Studio, and Visual Studio Code, as well as languages such as Java, Python, Node.js, and .NET, making it a versatile tool for various development environments.
-
Robust Security Controls: Ensuring the security and privacy of application data, Lightrun is compliant with ISO-27001, SOC 2, GDPR, and HIPAA, providing enterprise-grade security features like encryption, authentication, and role-based access control (RBAC).
What are the characteristics of Lightrun?
Lightrun stands out due to its distinct characteristics that enhance developer experience:
-
Real-Time Debugging: With Lightrun, developers can debug applications in live production, allowing them to address issues as they arise rather than relying on after-the-fact logging.
-
No Code Modifications Required: Unlike traditional debugging tools that require code changes or redeployments, Lightrun operates purely through metadata injection, preserving the integrity of production environments.
-
Negligible Footprint: The platform is designed with minimal overhead, ensuring that it does not affect the performance of the applications it monitors.
-
Integrated with Top Observability Tools: Lightrun provides over 30 integrations with leading observability tools, ensuring that developers can work within their existing workflows without disruption.
What are the use cases of Lightrun?
Lightrun is beneficial for a variety of scenarios across development and operational teams:
-
Live Debugging in Production: Capture context in real-time without stopping execution, providing visibility down to the single line of code, essential for diagnosing critical issues.
-
Troubleshooting Cloud-Native Applications: Gain a comprehensive view across replicas, regions, and entire clouds, making it easier to diagnose complex issues in distributed environments.
-
Analyzing CI/CD Pipelines: Quickly resolve issues in Continuous Integration (CI) processes without rerunning jobs unnecessarily, thus optimizing productivity and resources.
-
Validating Feature Flags: Ensure that feature flags operate as expected by dynamically instrumenting logs and metrics to assess the impact of changes on production behavior.
-
Performance Analysis: Identify and analyze performance bottlenecks within applications to improve user experience and system efficiency.
How to use Lightrun?
To start leveraging the powerful capabilities of Lightrun, follow these steps:
-
Install the Lightrun Plugin: Download and install the Lightrun plugin for your preferred IDE from the official website.
-
Connect to Your Application: Configure the plugin to connect with your live production application environment.
-
Dynamic Instrumentation: Use the IDE to add dynamic logs, metrics, or traces wherever needed without restarting or modifying your running application.
-
Analyze Insights: Observe metrics and logs in real-time directly within your IDE or through integrated observability tools to gain immediate insights into application performance.
-
Collaborate with Teams: Share insights with your engineering teams to facilitate quicker issue resolution and improve overall development processes.
Lightrun Pricing Information:
For pricing details, please visit Lightrun Pricing.
Lightrun Company Information:
Learn more about Lightrun and its vision by visiting the About Us.
Lightrun Contact Email:
For further inquiries, reach out via email at [email protected].
