What is Piktochart?
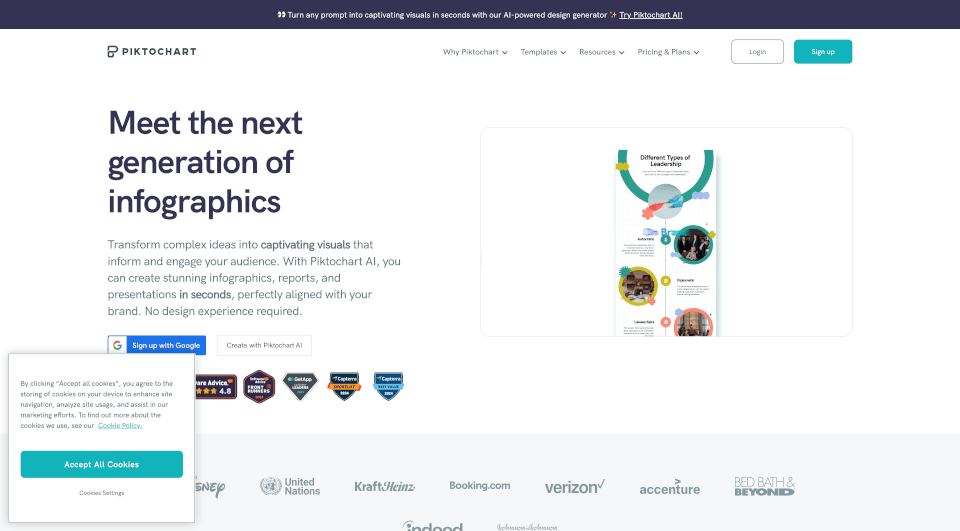
Piktochart is an innovative visual communication tool that empowers users—whether they're educators, marketers, or business professionals—to create stunning infographics, presentations, reports, and other visuals without the need for extensive design skills. With over 11 million users, Piktochart's intuitive platform and AI-powered design generator make it easy to transform complex ideas into captivating visuals quickly. From social media graphics to detailed reports, Piktochart caters to all your visual storytelling needs.
What are the features of Piktochart?
AI-Powered Design Generator
Utilize advanced AI technology to create visually appealing graphics in seconds. This feature allows users to convert text prompts into engaging visuals, making it effortless to generate infographics, banners, flyers, and more.
Customizable Templates
Choose from a variety of customizable templates across different categories, including infographics, presentations, brochures, and reports. This feature ensures that users can find designs that match their specific needs and branding.
Extensive Design Library
Leverage a vast library of icons, illustrations, charts, and graphs to enhance the quality of your visuals. Users can also upload their images for a more personalized touch.
Collaboration Tools
Piktochart includes collaborative features that allow teams to work together seamlessly. Users can comment, review, and make revisions within shared workspaces, similar to the functionalities found in Google Docs or Microsoft Teams.
Brand Management
Maintain brand consistency with the Brand Kit feature, which provides easy access to your brand's colors, fonts, and logos. Users can create Branded Templates, ensuring their visual content aligns perfectly with their company's branding.
Variety of Visual Tools
From charts and graphs to diagrams and flowcharts, Piktochart offers a diverse range of visual tools. Users can create intricate data visualizations tailored to their specific audience and context.
Interactive Maps
Visualize geographical data with Piktochart's interactive map feature, which allows for customization and presents data in a clear format.
What are the characteristics of Piktochart?
Piktochart stands out for its user-friendliness, making it accessible to individuals with no prior design experience. The platform's simplicity combined with powerful design features results in high-quality visuals that cater to various sectors, including education, healthcare, marketing, and business consulting.
What are the use cases of Piktochart?
Piktochart can be employed in numerous scenarios such as:
-
Education: Teachers and students can create engaging lessons and presentations. Piktochart's templates help in converting complex subjects into understandable visuals, enhancing retention and engagement.
-
Marketing: Marketers can design eye-catching social media graphics, brochures, and reports that effectively communicate their brand message and campaign results.
-
Business: Companies can develop professional pitch decks, proposals, and reports that present data clearly to stakeholders, helping to secure investments and approvals.
-
Consulting: Consultants can leverage Piktochart to create detailed visuals that simplify complex concepts and foster better understanding during client presentations.
-
Nonprofits: Organizations can utilize Piktochart to create impactful visuals for fundraising, awareness campaigns, and progress reports, effectively communicating their missions to stakeholders.
How to use Piktochart?
- Sign Up: Create a free account on the Piktochart website.
- Choose a Template: Select from various templates or start with a blank canvas.
- Customize Your Visuals: Use the AI design generator to input your content and generate visuals. You can also manually edit the design elements, changing colors, fonts, and images.
- Add Graphics and Data: Utilize the design library to enrich your project with icons, charts, and other visual elements.
- Collaborate: Invite team members to collaborate on your project and make any required adjustments.
- Download or Share: Once completed, you can download the visual in various formats or share it directly from Piktochart.
Piktochart Pricing Information:
Piktochart offers several pricing plans:
- Free Plan: Access to basic features and templates.
- Pro Plan: Designed for professionals and small teams, offering enhanced features at a competitive price.
- Enterprise Plan: Tailored for organizations needing more robust support and custom solutions.
- Educational Plan: Discounted pricing for students and educators.
- Nonprofit Plan: Special pricing for registered nonprofit organizations to facilitate their visual communication needs.
Piktochart Company Information:
Piktochart is dedicated to making visual storytelling accessible to everyone. They value innovation, user experience, and helping individuals and organizations communicate their ideas effectively through engaging visuals.
