What is Graphy?
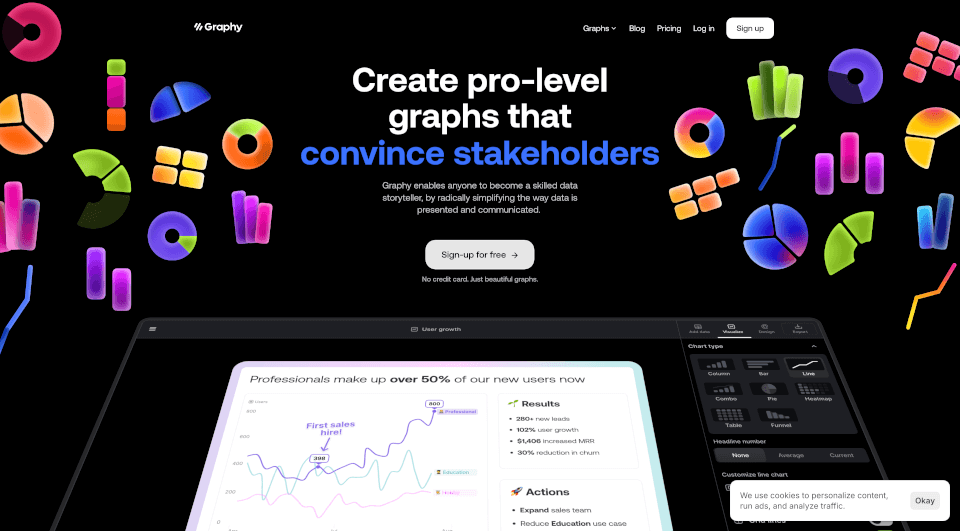
Graphy is a cutting-edge tool designed to transform raw data into compelling visual stories. It empowers users to create stunning, interactive graphs that not only present data beautifully but also drive actionable insights. With Graphy, anyone can elevate their data storytelling skills and effectively communicate information without the usual complexities of traditional data visualization tools.
What are the features of Graphy?
-
AI-Generated Graphs: One of the standout features of Graphy is its AI capability, which can instantly generate graphs and provide insights based on the data you input. This feature simplifies the data interpretation process, making it faster and more efficient.
-
Beautiful Visuals: Graphy takes pride in offering a range of aesthetically pleasing templates that ensure your graphs are not only functional but also visually impressive. This enhances audience engagement and makes presentations more compelling.
-
Interactive Sharing Options: Whether you're sharing in a team setting or presenting to stakeholders, Graphy allows for easy collaboration. Users can share interactive links, embed graphs into existing platforms, or export images directly into slides.
-
Rich Storytelling Tools: With features that allow visual annotations, trend lines, and goal markers, Graphy enables users to highlight critical insights effectively. This turns raw data into a narrative that can captivate and inform the audience.
-
Multiple Data Sources: Graphy supports data inputs from various sources, including Google Sheets and manual data entry, allowing users to consolidate information effortlessly.
-
Accessible Interface: The user-friendly interface is designed to minimize the learning curve, making it an ideal choice for both beginners and seasoned professionals.
What are the characteristics of Graphy?
Graphy is characterized by its ability to make data visualization accessible and enjoyable. It combines powerful features with delightful usability to facilitate better decision-making. The software is significantly faster than traditional tools, boasting speeds that can be up to 80% faster, ensuring users can spend less time on design and more on analysis and discussion.
What are the use cases of Graphy?
-
Business Presentations: Graphy is perfect for delivering impactful business presentations. Users can create stunning visuals that clearly communicate performance metrics and forecasts to stakeholders, helping make data-driven decisions.
-
Marketing Reports: Marketing teams can leverage Graphy to present campaign results and audience insights in a visually appealing manner, capturing the attention of clients and partners.
-
Educational Purposes: Educators can utilize Graphy to present complex data in classrooms, making lessons more engaging and easier to understand for students.
-
Internal Reporting: Companies can streamline their reporting processes with Graphy, allowing teams to compile reports that are both informative and visually captivating, reducing the need for overly complex spreadsheets.
-
Social Media Content: For businesses and influencers, Graphy is an excellent tool for creating visually striking graphs for social media posts, helping to convey messages quickly and effectively.
How to use Graphy?
- Sign Up: Create a free account on the Graphy website. No credit card is required.
- Input Data: Use the AI tool to input your data either by pasting from existing sources like Google Sheets or manually entering it.
- Customize Graphs: Choose from a selection of graph types and customize them as needed with data annotations and insights.
- Share or Export: Once your graph is ready, either share it directly with team members, or export it for use in different applications.
